By Arthur R. Preiss, Ph.D. and Philip B. Preiss
Unless you’ve been hiding under a rock, you know that redlining is a key focus of the regulators in 2017. Redlining is the practice of discouraging applicants or denying loans in specific geographic locations. This article discusses one aspect of how a bank should assess its redlining risk, by analyzing its lending practices in comparison to its peers.
Defining your peers is important to your redlining analysis because your peers list may show that your bank is not pulling its weight with respect to applications or originations in minority or low and moderate income neighborhoods. The suggested methodology in this article may not be the only way to identify your peers, but it may be useful at least as a starting point.
Our experience when working with clients is that when we ask banks for peers, they respond with all banks within a geography, some of the banks within a geography, or just a random list that perhaps the marketing department supplied. In most cases, the lists are not derived in any thoughtful way. Furthermore, there is no rational methodology behind choosing the banks included on the list, and hence, the list is not very valuable to the regulator. One alternative to this approach to identifying peers, is to let regulators do it for you. But, who is best positioned to put together your peer list? You or the regulator de jour?
Let’s start with a discussion about what is redlining, explore current methods of selecting peers, and conclude with examples of different peer selection methods.
Redlining: A Primer
When banks felt that lending in certain geographic areas would be too risky, it became known as redlining, as a metaphor for drawing a red line around a neighborhood on a map, often targeting areas with a high concentration of people of certain races or socioeconomic classes. Redlining analysis has become a regulatory hot topic and helps banks to assess their redlining risk. The key components of a redlining analysis are:
- Qualitative redlining risk indicators;
- Quantitative redlining risk indicators;
- Mapping;
- Reasonably Expected Market Area (REMA) analysis; and
- Peer analysis.
Qualitative Redlining Risk Indicators
Qualitative redlining risk indicators are those that are not numerical in nature. They can often be inferred by reviewing bank applications or lending in disadvantaged geographies such as high minority areas or low/moderate-income geographies. These risk indicators include:
- Having policy of not lending in certain geographies;
- Limiting marketing;
- Soliciting loans only in selected geographies;
- Pricing loans higher in selected areas;
- Offering less advantageous products in high prohibited basis or low/moderate geographies; and
- Having no branches, brokers, LPOs, desk rentals in or near high minority or low/moderate-income areas.
Eliminating any or all of these risk indicators is likely to reduce a bank’s redlining risk.
Quantitative Redlining Risk Indicators
As suggested by the title of this section, these indicators are typically the result of numerical calculations of bank application or loan origination patterns compared to a bank’s peers. These risk indicator comparisons can be done two ways: 1) in percentages and 2) in odds ratios. Of these two options, percentage distributions seem to be most common. That is, a bank’s distribution of loans or originations by race/ethnicity or income class category compared to its peers’ distribution of loans or originations in one of these categories. Table 1 provides an example.
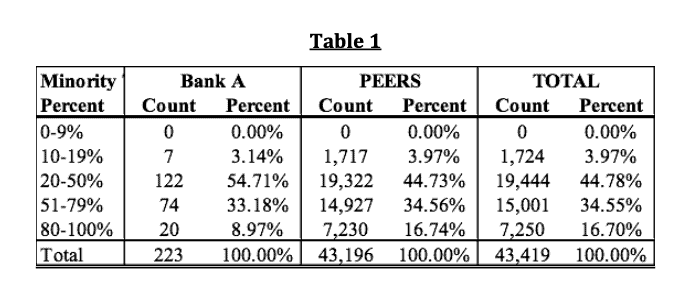
Table 1
In Table 1, Bank A has about 42% (33.18 + 8.97) of its loans in majority minority neighborhoods whereas its peers have a little more than 51% (34.56 + 16.74) in the same majority minority neighborhoods. In terms of the Bank A’s odds ratio, 0.6917 (72.86/105.34), Bank A is about 31% less likely to have a loan in a majority minority neighborhood. The last question with respect to Table 1 is whether the difference between 51% and 42% is statistically important. A statistical test called a t-test (not shown) indicates the difference is not statistically important. Thus, based on this statistical test, the distribution of Bank A’s loans in majority minority neighborhoods is not very different than its peers, and the likelihood is that Bank A is not redlining relative to its peers.
REMAs (Reasonably Expected Market Areas)
The FFIEC defines a REMA as “an expected market area where the institution actually marketed and provided credit and where it could reasonably be expected to have marketed and provided credit.” While the concept of a REMA has been around for some time, it has recently risen to prominence in at least one DOJ =lawsuit—KleinBank. One of the issues in the Klein Bank case is that the institution wanted the analysis done based on its CRA assessment area. According to the regulators, a REMA is defined to be where an institution marketed and provided credit or where it could reasonably be expected to have marketed or provided credit. Thus, REMAs do not necessarily coincide with CRA assessment areas. According to the regulators, the following factors determine a REMA:
- Where the bank has received applications or originated loans;
- The banks history of mergers and acquisitions;
- The market area as defined in bank policies;
- The bank’s structure and history; and
- The bank’s advertising and inappropriate exclusion of MMTs from the assessment area.
However derived, banks are expected to provide equal access to credit in their REMAs. As in the case of the peers, your input into identifying your institution’s REMAs is very important in possibly reducing indications of redlining.
MAPS
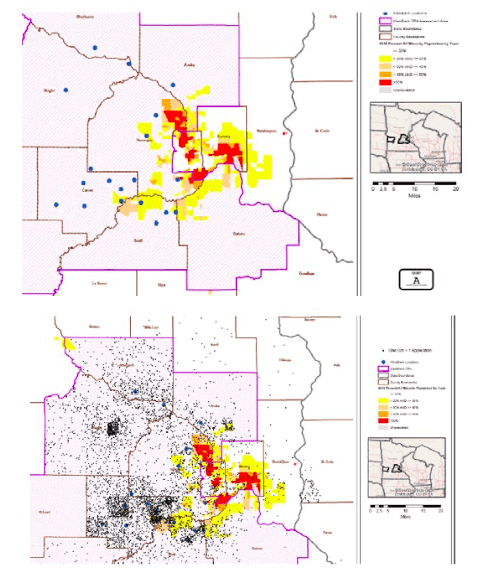
Mapping is a key to redlining analysis. Using maps, you can identify potential disparate treatment issues, facility location questions, recognize REMAs and look for peers. The map below is from the KleinBank case.
Notice in the first map above, the large dots, which represent branch locations, seem to be mostly outside the majority minority census tracts (indicated in red, orange, and yellow). While the branch locations may not prove redlining exists, their locations taken collectively may at least warrant a bank explanation. Other maps, such as the second map, show the location of applications. This map seems to confirm the conclusion from the first map. That is, bank applications come from mostly outside higher minority census tracts.
Peers
According to an article in the Fall 2016 issue of Supervisory Highlights, the Consumer Financial Protection Bureau (Bureau) develops peer lists three different ways. The regulators may start by choosing a peer set that contains all banks in a Metropolitan Statistical Area (MSA). How the MSA is chosen is not clear, but it is reasonable to assume it would be an MSA with a significant number of a bank’s applications or originations and appropriate demographics. Another way banks select an MSA is to choose MSAs where the target bank and the potential peers each have at least one branch in the MSA. We have chosen to use this filter in the examples at the end of this article. It is important to note here that this means just because “Institution A” might be listed as a peer bank in MSA 1 it does not mean that “Institution A” will be listed as a possible peer bank in all or any other of your MSAs. Therefore, your list of peer banks may vary from one MSA to another.
A second peer list may then be constructed to include those banks that have assets or applications or originations between 50% and 200% of the target bank (Bank A in our example above). The third peer list that may be created by the regulators is called a refined peer list. Typically, these additional peer data sets are defined such that they more closely match the profile of the target bank. That is, they may match the target bank in terms of loan type, property type, loan purpose, owner occupancy and lien status. Another way to think of this comparison is that the banks have similar focal points. This matching process can be done manually or by using the institutional database matched with the raw HMDA data.
The reality is that comparing your bank to all the other banks in an MSA or even banks with assets, originations, or applications in the 50%-200% range, may not reflect an accurate picture of how your institution compares to its 50%-200% peers. If that is the case, it may be up to your institution to define a list of potential peer banks.
The important part of the peer analysis process is that you should do your own peer analysis and not necessarily rely on the peer data set the regulators may try to use. After all, as said earlier, who knows your business and your peers better, you or your regulator?
One further point about peers. Practice suggests that your final peers list should be the result of a discussion between fair lending compliance and other bank departments. Marketing departments are the obvious candidate to include but experience shows that they sometimes are myopic and do not include all the reasonable peers. Whatever the decision, a thoughtful peer listing is important to a bank’s redlining analysis and potentially reduces your redlining risk.
It should be pointed out that each refinement to the Bureau’s peer definition affects the listing of potential peer banks in each MSA. This is important because with each iteration, the number of banks changes and the situation may arise that there are no qualifying peer banks based on the definition implemented at that point. Not having any peer banks to compare against in an MSA is not likely to be acceptable during a regulatory review and would require further analysis for this area. Regardless of how unique an institution may be, the goal of a refined peer bank list is to find the most similar institutions to your own. While there is no goal as to the number of peer banks you should have in an MSA, the number may vary from MSA to MSA.
Peer Bank Example
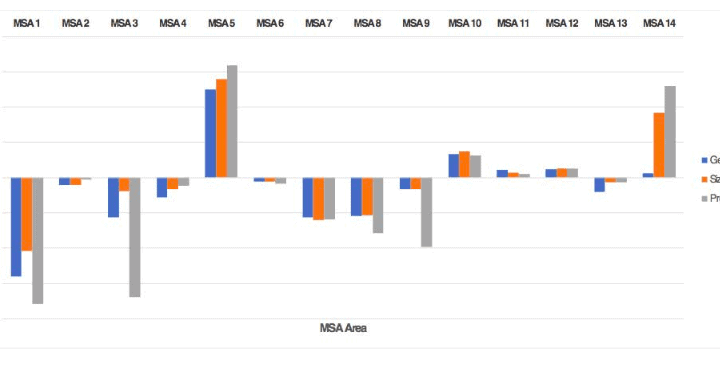
Using the methodology outlined above, an example redlining analysis was performed to show the volatility associated with selecting peer banks. The chart below provides a summary of how the target bank compared to three sets of peer banks across each MSA in our example redlining analysis.
There were 16 MSAs of interest identified for our target bank, selected by target branch location, for this example. In each of these 16 MSAs there are three sets of peer banks used to compare the target bank against, which is a common regulator practice. These are represented by the sets of three bars stacked together under each MSA number. The length of each of the bars illustrates how target and peer bank application percentages compare in GTE-50% minority census tracts.
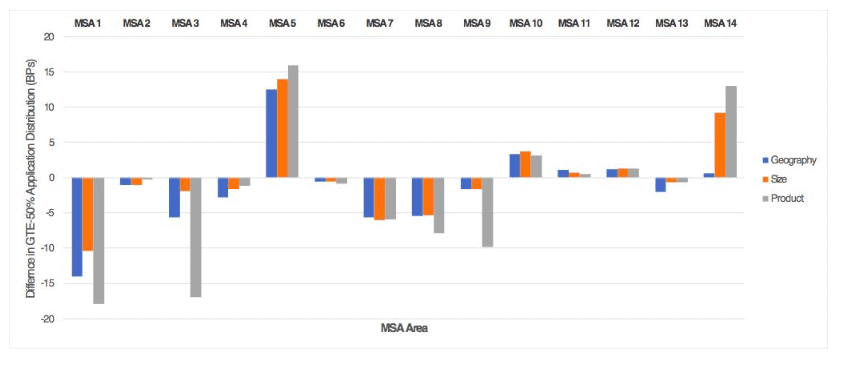
There is a large range in the difference displayed in the chart above. Some MSAs have a large difference for each peer bank comparison (MSA 1, MSA 5, and MSA 14) while other are smaller (MSA 2, MSA 6, and MSA 11). Additionally, there is a clear disparity in that some MSAs show that the target bank has larger application percentages in GTE-50% minority census tracts (MSA 5, MSA 10, and MSA 14) while other MSAs show room for improvement for the target bank (MSA 1, MSA 7, and MSA 8). Furthermore, note that no trends arise as additional filters are applied and thus each set of peer banks will have an independent effect on the redlining analysis. (MSA 1, MSA 3, and MSA10).
The purpose of this example is to show the variation of results that can occur during redlining analysis and how much of the variation that does occur is based on the peer definition used by the target bank. The magnitude differences, directional differences, and trend differences between target and peer bank application distribution percentages, are a few of the ways peer bank lists can affect redlining analyses. However, it is important to remember that regulators are likely to use more than one set of peer banks to determine a target bank’s redlining performance.
The variability in the results discussed above suggests a significant level of uncertainty is associated with choosing a peer bank grouping for comparison to the target bank. To be prepared for the options regulators may have in choosing possible peer bank groupings, target banks should examine the various possible peer bank groupings themselves.
ABOUT THE AUTHORS
Arthur R. (Rick) Preiss, PhD., President and Founder of Preiss&Associates, LLC., (www.preissco.com), works with all sizes of financial institutions to perform custom fair lending risk assessments, mentor in-house fair lending modeling processes, and collaborate to maximize software value. Located in Lake Forest, Illinois, Preiss&Associates has been a full-service compliance consulting firm since 1992, serving clients nationwide. Their unrivaled fair lending experience is utilized by financial institutions and law firms defending financial institutions, to perform a wide variety of statistical fair lending analyses. Risk areas covered include underwriting and pricing and redlining for credit products.
Rick is a graduate of Emory University and received an M.B.A. and Ph.D. from Indiana University. He can be reached at rpreiss@preissco.com.
Philip B. Preiss is the manager of consulting and analytics at Preiss&Associates, LLC., Phil has directed the company’s use of statistical procedures to perform fair lending analyses including assessing fair lending risks such as underwriting, pricing and redlining for various credit products.
Before joining Preiss&Associates, Phil’s career was spent in the logistics industry producing transportation efficiency models for Coyote Logistics. During his time at Coyote, Phil’s position on the strategy team allowed him to help grow the 2011 startup company to a over a $1 billon revenue company, eventually purchased by UPS in 2015.
Phil’s involvement with modeling was developed while earning his Bachelor of Arts degree from Hamilton College where he graduated with a concentration in Mathematics.

